In this section of our ParaPro Study Guide, we will be looking at non-literary content that you may encounter on the reading exam. Visuals such as graphs and charts are important ways to communicate information, and our study guide below will ensure that you can read and analyze them successfully.
Reading and Analyzing Visuals
On the reading exam, you’ll likely be given a visual and asked to draw a conclusion based on its contents. This may be a graph, a chart, or a diagram. If you are unfamiliar with the most common types of graphs and charts, you can review them on the Data Analysis page of our Math Study Guide.
It’s important to try and study the graph and draw your own conclusion about the data before reading the answer choices. That way, you’ll have a good idea of what the visual is telling you prior to looking at the answers.
Be sure to read through the visual and the question carefully. Circle or underline key words in the question, such as “most,” “least,” “true,” or “false.” Many mistakes are made when students don’t thoroughly check a question that is intended to trip them up. You should always double-check your answer as well.
Let’s try an example.
Example 1
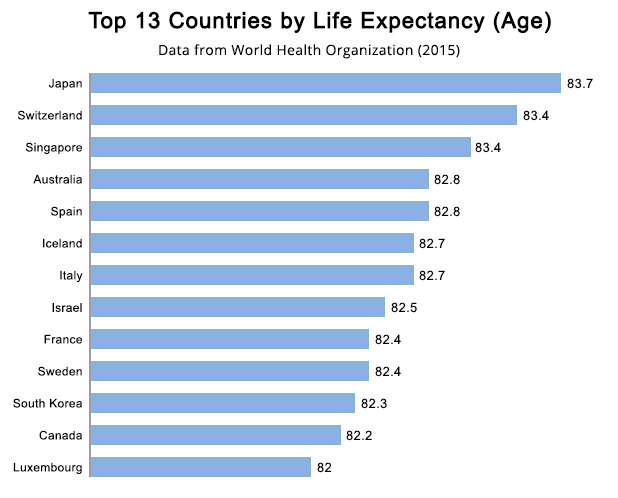
What conclusion can be drawn from the bar graph above?
- People in Canada can expect to live longer than people in Sweden
- The only country South Korea trails behind in life expectancy is Sweden
- Australia has a longer life expectancy than Spain
- Three countries have a life expectancy of over 83 years old
The best strategy is reading each answer and checking if it is reflected in the graph. The graph clearly shows that people in Canada don’t live as long as people in Sweden, so option (A) can be eliminated. In option (B), South Korea’s life expectancy trails behind every country listed above it, so that is incorrect. Option (C) can be tricky because Australia is listed ahead of Spain. However, by reading the numbers at the end of each bar, we can see the countries have the same age listed, so Australia doesn’t have a longer life expectancy than Spain. As for option (D), you can find three countries with life expectancies over 83, making that the correct answer.
Now employ the graph reading and test-taking strategies learned above on our brief review test below. This review closely mirrors the questions you can encounter on the official ParaPro Exam.